As the midterm election season unfolds, investors are watching closely for the outcome because of its implications for Congressional control. Current forecasts suggest that a divided government is the most likely scenario, since Republicans hold slim majorities in both the House and Senate.1 Although a shift in party control would represent a change from the past two years, these situations are common and tend to occur during midterm election cycles.
While election outcomes are never certain, one thing is clear: the federal budget deficit grew to just under $2 trillion over the past year, its highest level in absolute terms since 2021.2 This means the government spent significantly more than it received in revenues. This is likely to remain the case regardless of which party controls Congress next year since challenges such as rising interest costs and entitlement spending have built up over decades. This adds to the national debt, which has risen past $40 trillion, or over 120% of the economy’s size.3
For investors who follow these headlines, it’s natural to feel concerned, regardless of political views. That is why it’s important to maintain a long-term perspective that separates political issues from investment and financial planning. What do investors need to know about the deficit and election this political season?
The federal budget deficit has grown

Before discussing how government spending affects financial markets, let’s review the numbers. The federal government recorded a $1.99 trillion deficit for the fiscal year that ended September 30, 2026, which represents an increase of 12% from $1.78 trillion the prior year.4 This is because the government spent $7.4 trillion but only collected $5.4 trillion in revenue via taxes, tariffs, and other means.5
The government covers this gap by borrowing through the issuance of Treasury securities, which investors and institutions worldwide buy. Based on current Gross Domestic Product (GDP) figures, the latest deficit is likely to be around 6% of GDP, similar to the ratio in 2025.6
The chart above shows that deficits in recent years have been higher than in most of history. The budget deficit has averaged 4% of GDP for nearly a century, and periods of financial and global disruption have widened the gap, such as during World War II and the 2008 global financial crisis.
Deficits tend to normalize after these events, but the government has operated with a surplus only briefly. The last time the budget balanced was during the Clinton administration, after a strong decade of economic growth; before that, it balanced during the Johnson and Eisenhower administrations in the late 1960s and mid-1950s, respectively.
Over time, these annual deficits add to the total national debt, which surpassed $40 trillion for the first time in August. According to the Congressional Joint Economic Committee, this amounts to about $117,707 per American, or $298,606 per household.7
While these figures are large and represent real fiscal challenges, they’re difficult to interpret. In reality, adjusting portfolios based on these issues would historically have worked against financial goals. This is because deficits are the largest during times of economic and financial distress, which tend to be when markets are near their lows. Counterintuitively, these were often the best times to invest.
Budget deadlines, the debt ceiling, and rising interest rates could be in the news
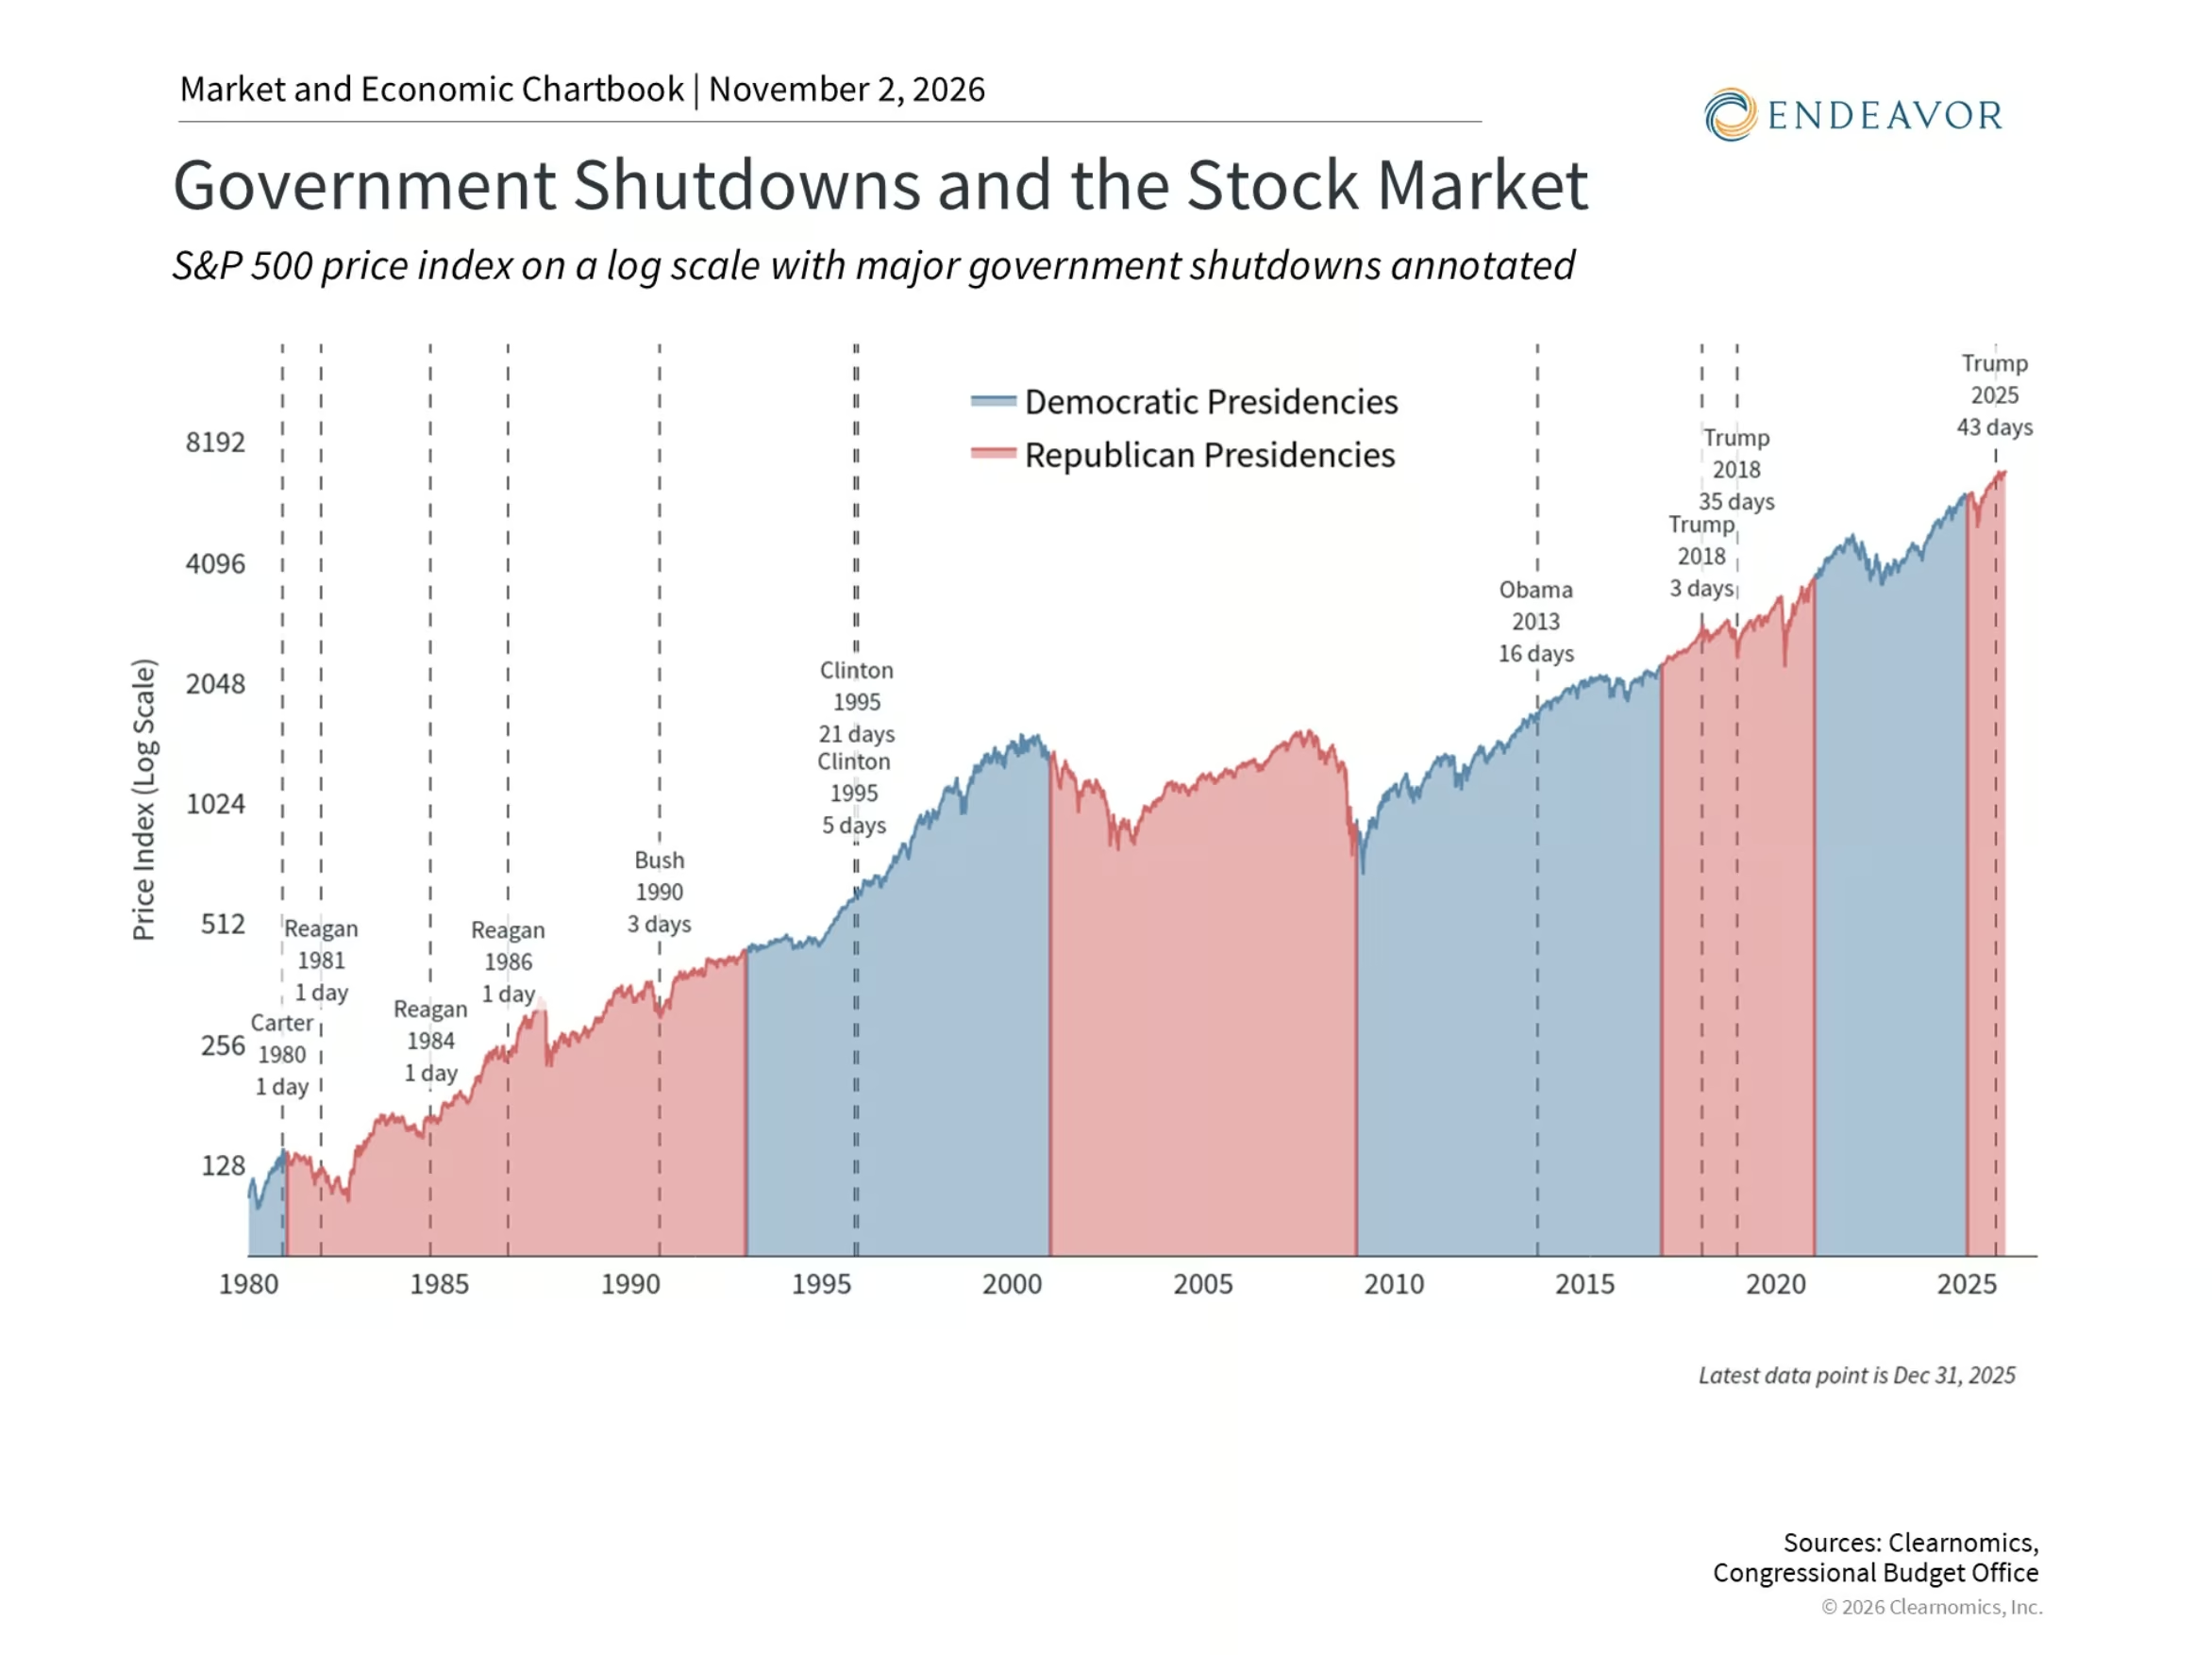
That said, long-term investors should be aware of two implications. First, the national debt is approaching the statutory debt ceiling of $41.1 trillion set by the One Big Beautiful Bill Act last year, which could be reached by mid-2027.8 The federal government’s deadline for a new budget is December 11, not long after the midterm election. Raising the debt ceiling will likely be a key debate for the next Congress and, if Congress does not act in time, there could be a government shutdown.
While shutdowns can cause hardship for federal workers and short-term market swings, major indices have tended to stabilize and move past these issues quickly. This is true even during historically long shutdowns, such as in 2018 and more recently in 2025. The chart above highlights historical government shutdowns and the stock market’s steady rise over this period. Of course, the past is no guarantee of the future, but this highlights the importance of not overreacting to political news when investing.
Second, rising interest rates are compounding the government’s fiscal challenges. The 30-year Treasury yield has stayed above 5% since June, while the 10-year yield still hovers near that level. This matters because as existing government debt matures, it must be refinanced at higher rates, increasing interest payments and worsening the budget imbalance. This is one reason the Treasury Department has intervened by buying more Treasury securities to help stabilize U.S. interest rates.9 It has even engaged in other operations, such as supporting the Japanese yen, to indirectly stabilize rates.
Policy uncertainty can lead to short-term volatility

The national debt is a long-term challenge with no simple solutions, since it involves decisions about taxes, entitlement programs, and spending priorities. At the same time, policy predictions have not always been accurate, especially during periods of strong economic growth. For example, the market decline that followed last year’s tariff announcements was shorter than many expected, and gave way to a rebound that brought major indices to new all-time highs.
This is why it’s important for investors to stay level-headed on political topics. The chart above shows that economic policy uncertainty has contributed to short-term market swings in recent years, but these periods have tended to be short-lived. Prior episodes, including this year’s geopolitical conflict in the Middle East, created volatility as investors tried to measure the impact on the economy and corporate profits. While oil prices remain elevated, markets have performed well on strong economic trends.
This isn’t to say every year is positive, the national debt isn’t a challenge, or policy is irrelevant. Instead, the point is that underlying factors such as corporate earnings, interest rates, and longer-term economic trends tend to drive market performance over time. For investors, it’s more important to make sound investment decisions based on these longer-term trends, rather than on political headlines or which party controls Congress.
The bottom line? The midterm election and the growing federal deficit are important topics, but history shows that long-term portfolio outcomes are driven by fundamentals rather than by political outcomes.
Endeavor Advisors, LLC (“Endeavor”) is a registered investment advisor. Advisory services are only offered to clients or prospective clients where Endeavor and its representatives are properly licensed or exempt from licensure.
The views expressed in this commentary are subject to change based on market and other conditions. These documents may contain certain statements that may be deemed forward-looking statements. Please note that any such statements are not guarantees of any future performance, and actual results or developments may differ materially from those projected. Any projections, market outlooks, or estimates are based upon certain assumptions and should not be construed as indicative of actual events that will occur.
The information provided is for educational and informational purposes only and does not constitute investment advice, and it should not be relied on as such. It should not be considered a solicitation to buy or an offer to sell a security. It does not take into account any investor’s particular investment objectives, strategies, tax status, or investment horizon. You should consult your attorney or tax advisor.
Diversification does not ensure a profit or guarantee against loss.
Investing in commodities entails significant risk and is not appropriate for all investors.
- https://www.realclearpolling.com/latest-polls ↩︎
- https://fiscaldata.treasury.gov/americas-finance-guide/national-deficit/ ↩︎
- https://fiscaldata.treasury.gov/americas-finance-guide/national-debt/ ↩︎
- https://fiscaldata.treasury.gov/americas-finance-guide/national-debt/ ↩︎
- https://www.realclearpolling.com/latest-polls ↩︎
- Clearnomics research using U.S. Treasury and Bureau of Economic Analysis data, as of October 23, 2026 ↩︎
- https://www.jec.senate.gov/public/index.cfm/republicans/debt-dashboard ↩︎
- Clearnomics research and U.S. Treasury data, as of October 23, 2026 ↩︎
- https://home.treasury.gov/news/press-releases/sb0607 ↩︎