Key Takeaways
- Markets have historically recovered quickly from Middle East conflicts. Across U.S. military engagements since 1983, equities have typically stabilized within weeks and posted positive returns in the months that followed.
- Energy supply disruption — not conflict itself — is the primary risk to watch. The most meaningful market impacts have historically occurred when oil production or shipping routes (particularly the Strait of Hormuz) were threatened, not simply when military action took place.
- The most likely scenarios remain contained and manageable for portfolios. Based on current conditions, the highest-probability outcomes involve limited or localized conflict that may elevate volatility temporarily but is unlikely to derail global growth or long-term returns.
- Staying invested and diversified has consistently been the best response. History shows that reactive portfolio changes during geopolitical crises tend to be counterproductive — disciplined, long-term investors have been rewarded for staying the course.
What Middle East Conflict Means for Your Portfolio: Lessons from History
Geopolitical events understandably create concern for investors, particularly when headlines involve military conflict in the Middle East. However, history provides useful context. Across U.S. military engagements since 1983 — from Grenada and Libya to Iraq and Syria — financial markets have typically experienced short-term volatility followed by stabilization within weeks and positive returns over the following months. Even larger conflicts, such as the Gulf War and Iraq (2003), ultimately saw markets recover once initial uncertainty faded.
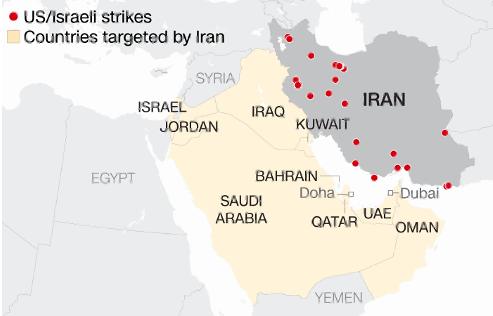
The most important factor determining market impact has historically not been the size or duration of conflict, but whether global energy supplies were disrupted. When oil production and shipping continued largely uninterrupted, markets generally normalized relatively quickly. Periods of higher oil prices did create temporary volatility, but those effects tended to diminish as supply risks stabilized. A sustained disruption to Middle East oil flows — particularly through the Strait of Hormuz — would represent the primary channel through which conflict could transmit recessionary pressure to the global economy and financial markets, with the most acute effects likely in Asia given the region’s heavy dependence on imported Gulf energy.
Based on currently available information, the most likely outcomes remain contained scenarios: either a limited conflict that eventually de-escalates or a period of ongoing but localized military exchanges. Historically, these types of situations have raised energy prices and market volatility for a time but have not derailed global growth or long-term equity returns. In these environments, markets often experience episodic pullbacks and shifts toward defensive sectors, followed by recovery as uncertainty declines.
Less likely but more adverse outcomes would involve broader regional escalation or meaningful disruption to oil supply. These scenarios could lead to higher inflation, tighter financial conditions, and more persistent market stress. Importantly, history suggests such developments are uncommon and typically require sustained supply loss rather than conflict alone.
For long-term investors, the key takeaway is that markets have repeatedly demonstrated resilience during geopolitical crises. While short-term movements can be unsettling, maintaining diversification and staying aligned with long-term investment plans has historically been the most effective response to periods of geopolitical uncertainty.
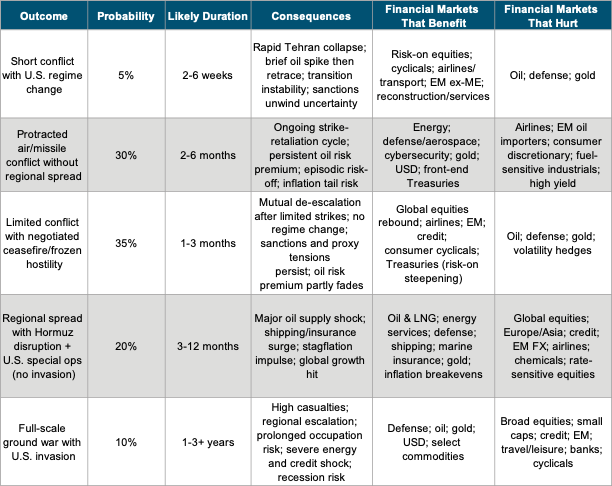
Estimated Probability of Outcomes
The table below outlines five potential scenarios, ranging from a short conflict with regime change to a full-scale ground war, along with our estimated probability for each. It also identifies which sectors and asset classes stand to benefit or face headwinds under each outcome. The two most likely scenarios — a protracted air/missile conflict (30%) and a limited conflict leading to a ceasefire (35%) — account for nearly two-thirds of probable outcomes and suggest manageable, short- to medium-term market disruption rather than a sustained downturn.
Historical Market Reactions to Conflicts
The chart below shows how the S&P 500 Index performed in the 65 trading days following the start of each conflict listed.

If you have questions about how current events may affect your portfolio or would like to discuss how our investment models are positioned for periods of geopolitical uncertainty, please contact us.
The information contained herein has been obtained from sources believed to be reliable, but it is not necessarily complete, and its accuracy cannot be guaranteed. No representation or warranty, express or implied, is made as to the fairness, accuracy, completeness, or correctness of the information and opinions contained herein. The views and the other information provided are subject to change without notice. Past performance is not necessarily a guide to future results. Predictions, forecasts, and estimates for any and all markets should not be construed as recommendations to buy, sell, or hold any security–including mutual funds, futures contracts, and exchange-traded funds, or any similar instruments.